Unless you want to enroll in a class or buy a textbook on social media analytics, it can be hard to find concrete information about how to interpret all the data points for your live videos. Rarely do I click on the unicorn of Google search results — one that provides the complete answer about how to use post insights and video data to make better content. Often the first question you’ll be asking yourself is, “How do I even choose which metrics actually matter to me?”
Social media strategy can feel complex — especially when it comes to benchmarking and measuring success through data and insights. You have to find the specific aspects that you understand, then try to grab the steering wheel and make the most of it. In this article, I want to give you some tips for evaluating the performance of your Facebook Live videos. I hope this will serve as a Facebook Insights guide that you can revisit in the future. But for today, try to identify which of these data points matter to you, then consider what they reveal about how you can improve your content.
What do these data points mean?
In this article, I’ll be focusing on Facebook video insights, but a lot of these concepts are applicable to other platforms as well. This information pertains specifically to video posts on Facebook Pages (not your personal timeline).
Finding your Facebook video insights
- To see the insights for each individual video, navigate to your page’s Publishing Tools.
- Under the Videos heading on the left, choose Video Library. On this page, you can view all your page’s videos including the Saved Live videos.
- Click on the title of a video to view the performance of this video in all the posts where it is used. A modal with video data will pop up for you to investigate stats specific to this video. (There actually are even more video stats that you can dig up by customizing a report, but we can talk about how to get that data another time.)
- For now, take a look at some of the data that are displayed initially.
Peak live viewers
Peak live viewers indicates the highest number of concurrent viewers who viewed your live video for at least 3 seconds. When you click on this metric, you’ll see a graph displaying the number of concurrent viewers at different points of your live broadcast.
One way to evaluate this graph is to see if there is a noticeable point in time when viewership begins to drop. If your audience suddenly starts to tune out, scrub to this part of your video and figure out why. This helps you see where your content failed to keep the live audience engaged and lets you make a change if necessary.
Don’t just try to do the opposite of whatever you did to make them stop watching, but try to be critical of your content and sympathetic to your audience. Consider mixing it up. Pick up the pace of your segment. Insert a poll to keep people watching to see the results. Choose a new format or outline for your content.
Minutes viewed
Minutes viewed is the total number of minutes your video was played, including time spent replaying the video. One important submetric to notice (below the graph) is the percentage breakdown of watch time between Page Owned and Shared. Here Facebook is helping you understand how much of your watch time is coming from the original post on your page itself (Page Owned) versus a third person/party’s share of your video showing up in a viewer’s newsfeed (Shared).
If your video is getting a significant portion of watch time from shares, this is a good indicator that this video content resonates with the audience enough to provoke the most powerful engagement, a share. Look at your content and think about ways you could increase watch time from shares. The obvious starting point is to brainstorm ways to get more shares in the first place. We’ll talk about engagements later on in this article, so keep reading if you want to know more.
1-minute, 10-second, 3-second video views
These are the number of times your video played for at least the indicated time span. During a single instance of a video playing, Facebook will count video views separately and exclude any time spent replaying the video. You’ll notice that an additional breakdown of these stats is available for 10-sec and 3-sec views — you can now see a comparison of how many are watching your video for these time spans with the sound on versus sound off. As the time span decreases, the number of people watching your content with the sound off will likely increase. For example, 3-second viewers are going to fly by your content without clicking on it. You might be able to convert some 3-sec views into 10-sec or 1-minute views if you turn on closed captioning after your video is live. If you want to get more 10-second or 1-minute viewers, try to rope them in with visuals that convince them to stay tuned longer.
You can’t force people to use Facebook with the sound turned on. But if you want to set a goal for improving these stats, start by trying to improve the proportion of 3-second to 10-second views.
Average video watch time
Average video watch time represents the average amount of time a video was played, including any time spent replaying the video during a single instance of the video playing. It primarily shows you the number of seconds or minutes watched, but there is also a statistic called Video Average Percent Watched that displays the amount of time as a percentage of your video’s total length. This metric can seem disheartening, especially if you have a ton of 3-second views on a video that is more than 10 minutes long. For reference, each of those 3-second views in this example would count as 0.5% watched. Those short views will pull your percentage down into the single digits and may make you feel as though your content isn’t working. But honestly, if your content is longform, don’t worry about this number being low. Divide your count of 10-second views by your count of 3-second views. If the result is around 50%, you’re probably doing just fine.
Now there might be some nerds (like me) reading this and thinking, “bUt WaIt, I kNoW aBoUt ThE mAtHs!” — adjusts glasses — “all I have to do is keep the length of all my videos down to something super short like 30 seconds if I want to increase the Average Percent Watched, because shorter videos mean a larger percentage will be watched!”
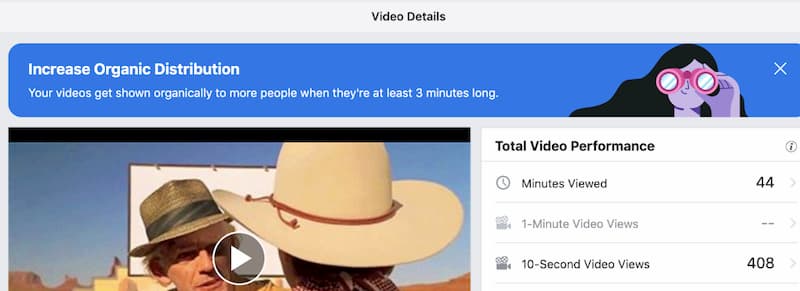
DON’T DO IT. As Facebook tells us, “Your videos get shown organically to more people when they're at least 3 minutes long.” Three minutes could be a perfect length for your content. But don’t limit yourself to this time span just to pump up a single metric. There are far more important things than view count and watch time.
Audience retention
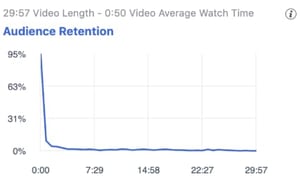
The Audience Retention graph is similar to the Peak Live Viewers graph. However, this graph does not include views while the video was live. It breaks down the video into 40 equal-length segments and shows the percentage of your video’s total views that occurred during each of the segments. Essentially, you can see how much of your audience is watching each part of your video. This graph has a tendency to look like a rapidly descending slide that slowly flattens out to 0. For the math nerds, it looks like f(x)=1/x.
Under the graph, you have some breakdown options that will help you get a deeper understanding of what’s happening with this viewership on this video. Click Zoom Chart to get a close-up of the important data. The first option allows you to display a breakdown of Followers versus Others. Naturally, your followers are probably watching more parts of your video, whereas others may be scrolling ahead and picking a chunk that looks interesting to them. Ask yourself how you can get a larger percentage of your followers to watch for longer.
The next breakdown shows Auto-Played and Clicked-to-Play. Naturally, people who clicked to play the video will have a larger percentage in each segment compared to the people for whom it auto-played. But notice if Auto-Played data points are still getting some percentage throughout the segments. Also, notice that, even when someone clicks to play your video, the retention at the end of the video won’t be as high as the retention at the beginning. Ideally, you would have 100% retention on all segments of your videos. But people get bored or distracted and decide to move on. Remember to put your logo in the first few seconds of your video or try to squeeze in a call-to-action as soon as you start. This short time span might be your best shot at making an impression on all the different types of viewers of your video.
Audience and engagement
Within the Top Audience and Top Location metric sections, you can, at first glance, get an idea of your video viewers’ gender, age, and location demographics. This may be useful to you if you want to define audience personas or see where your audience is located. You can also see a comparison of this video’s demographics with your average over the past 30 days. If you are trying to get more viewers in a specific area, try checking in on the video post, or tag a city where you would like people to discover your video.
The last set of metrics in this section are the Video Engagement and Post Engagement stats. This is arguably the most important insight to keep track of and improve. There are three kinds of engagements: reactions, comments, and shares. Within the Video Engagement section, you can see a graph of each engagement type throughout your video. Hover over the graph to see which kinds of content provoke specific engagements. You can also click on specific reactions (like “love”) to see when your video evoked a reaction from your audience. You can also hover over shares to see the moment when your video was shared.
The Post Engagement stats give you the total number of engagements and a breakdown of the three engagement types. The breakdown of each reaction type can also be viewed here. This area reveals an extremely important aspect of engagement.
If there is one important takeaway from this article, it is this: Strive for reactions from shares and comments from shares.
I consider my videos successful if I can drive a large number of comments and reactions. An even deeper feeling of accomplishment comes over me when I see that my video has also provoked a number of shares. But nothing illustrates the sheer magic of social media like racking up comments and reactions from shares. If you have been able to provoke engagements from a third party who is viewing your video secondhand because one of your original viewers shared your content, you are definitely doing something right. After you look into these stats, see if you are able to increase comments and reactions from shares in your future videos.
Subscribe to the blog
Sign up to receive notifications whenever a new blog post is published. You may unsubscribe at any time.
Share
About the Author

Jimmy is an experienced video content producer with special expertise in multicamera livestreaming, video editing, and audio mixing. In addition to the tech know-how, Jimmy is an expert in optimizing video performance — staying up on best practices for hosting platforms like Facebook and YouTube.
All posts by Jimmy Burns